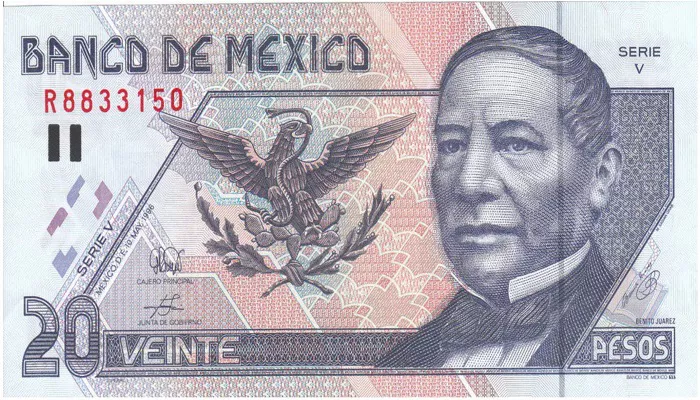
The Mexican Peso witnessed an appreciation of 0.50% against the US Dollar this week, capping off a period of market activity influenced by a blend of economic data and anticipation of central bank actions. The peso’s recovery came after Thursday’s losses, with the USD/MXN trading at 20.11, down from a high of 20.26 during the North American session.
Mixed economic data from the US provided fodder for speculation regarding the Federal Reserve’s (Fed) next move. Import Prices inched up by 0.1% month-on-month in November, matching October’s figure and defying expectations of a decline. In contrast, Export Prices remained flat, slipping from October’s 1% increase. These figures, combined with other economic indicators, have bolstered the odds of a Fed rate cut next week.
In Mexico, economic data painted a somewhat complex picture. Inflation dipped below estimates in both headline and underlying prices in November, strengthening the case for the Bank of Mexico (Banxico) to consider another rate cut at its December 19 meeting. However, Consumer Confidence deteriorated, and Industrial Production figures for November signaled an ongoing economic slowdown.
Despite the peso’s historical pressure from the harsh rhetoric of US President-elect Donald Trump, who threatened tariffs on Mexican imports, the USD/MXN continued to decline, driven in part by the maintained interest rate differential. The peso has been buoyed by market expectations of rate cuts from both the Fed and Banxico.
Looking ahead, the focus remains on the upcoming central bank meetings. The swaps market anticipates Banxico will lower its primary reference rate from 10.25% to 10.00%, while traders are predicting a 93% chance of a 25 basis points rate cut by the Fed. After the Fed’s decision, investors will closely watch Chair Jerome Powell’s press conference for insights into the 2025 policy path.
From a technical perspective, the USD/MXN has been consolidating in the 20.00 – 20.25 range for five consecutive days. Momentum has turned slightly bearish, as indicated by the Relative Strength Index (RSI). The first support level is the 50-day Simple Moving Average (SMA) at 20.07, with further potential declines toward 20.00 and the 100-day SMA at 19.70 if the bearish trend persists. On the upside, a break past 20.25 could see the pair test 20.50, and potentially reach the December 2 high of 20.59 and the year-to-date peak of 20.82.
Related topics:
Australian Dollar’s Struggle Against Solid US Dollar Ahead of US CPI
USD/CHF Holds Firm Above 0.8800 Ahead of Key Events


